
INtime SDK Help
INtime Debugging Tools
INtime software provides tools for debugging RT applications.
The INtime development environment includes these debugging tools:
INtime integrates with the Visual Studio environment in such a way as to provide services to the Visual Studio debugger from the INtime kernel. Debug your real-time applications from within Visual Studio using the environment you are familiar with. Before debugging an INtime project, select the target Node in the INtime project settings. If this node is on the local system, or is an INtime Distributed RTOS Node, the Node must be started in order to select it. If the target is an INtime for Windows runtime system (with no development tools), see the section on Remote Debugging (below).
When a hardware fault is detected on the INtime kernel, this Windows background application displays a dialog. The user may then select an action to handle the fault condition.
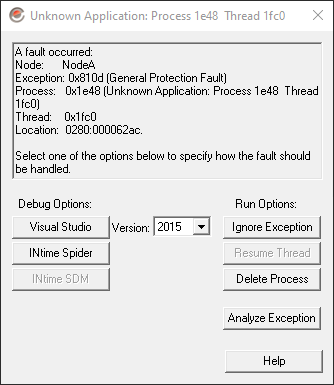
This application is launched automatically by the Fault Manager when configured to display a dialog. It may be launched manually (from the Windows start menu, or from INtime Explorer -> Tools menu for example) to probe for faults on INtime Distributed RTOS nodes, or on INtime for Windows nodes connected via the winntxproxy utility. The user may select a node to connect to in order to handle a previously-reported fault.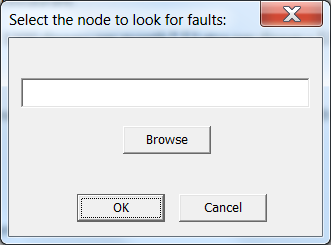
A Windows program used to provide the means to debug an application on a remote target system, without installing the development tools on the target system. It allows the development tools to connect to the remote system via NTX in order to use the debuggers and tools such as INtime Explorer and INscope on the remote target. For more detail see the section Remote Debugging, below.
A Windows-based RT object browser. The INtex program, through its self-loaded RT counterpart, an show the state of all RT processes, threads, and objects. It can also create a crash report when a thread in a process has had a hardware exception (crash analysis).
INtime Explorer may be used to watch for unhandled hardware exceptions and to generate a log file for off-line processing. Details may be found here.
The INscope Real-time Performance Analyzer is a Windows application that allows you to trace execution of INtime applications. Trace information for thread switches, system calls, and interrupt handling appears in a graphical user interface with various tools available to allow system analysis.
To view CPU usage in both the Windows and RT kernels, you can run the Window Performance monitor. Viewing CPU activity provides the feedback you need to determine if you divided labor appropriately between Windows processes and RT processes.
To view Windows and RT kernel activity in the Windows Performance Monitor:
Open the Performance Monitor by launching perfmon.exe from a command prompt, and select Performance Monitor in the left pane.
| Object | Counter | Purpose |
|---|---|---|
| Processor | % Processor time | Displays the percent of time devoted to Windows work. |
| INtime kernel | RT kernel CPU usage (%) | Displays the percent of time devoted to RT work. |
| NTX Outstanding Requests | Displays the number of NTX requests awaiting completion. | |
| NTX Requests per second | Displays the number of NTX requests started each second. |
You can now run your INtime application and observe the CPU usage of both the Windows and RT kernels. When viewing the CPU usage, keep in mind that the Performance Monitor displays total CPU usage which includes more than the activity generated by an INtime application. Each counter has a separate instance for each local INtime node, or you can select the total for all local nodes.
The NTX counters indicate how busy the Windows to INtime interface is. The outstanding requests counter shows how full the NTX queue is. The size of the queue may be adjusted in the System Wide configuration in the Node Manager, by changing the value of Max Concurrent NTX Requests.
To use the counters, click the Add Counters toolbar button, then expand the INtime RT Kernel group. You will see counters for NTX Outstanding Requests, NTX Requests per Second, and RT Kernel CPU usage (%). Each of these may be displayed per-kernel or grouped as a total for each counter.
When the RT kernel is running, a protection fault which occurs in the RT portion of an INtime application is handled by the default system hardware exception handler which suspends the faulting thread. Such threads display in the INtime Explorer with the state "suspended because of an exception". For threads in this state, the CPU frame displays the thread's CPU context when the hardware fault occurred, including the CS:EIP address of the faulting instruction.
The error code indicates the fault encountered as follows:
| Fault | Code | Description |
|---|---|---|
| EH_ZERO_DIVIDE | 0x8100 |
Divide by Zero error |
| EH_SINGLE_STEP | 0x8101 |
Single Step |
| EH_NMI | 0x8102 |
NMI |
| EH_DEBUG_TRAP | 0x8103 |
Debug Interrupt (Ignored by handler) |
| EH_OVERFLOW | 0x8104 |
Overflow error |
| EH_ARRAY_BOUNDS | 0x8105 |
Array Bounds error |
| EH_INVALID_OPCODE | 0x8106 |
Invalid Opcode error |
| EH_DEVICE_NOT_PRESENT | 0x8107 |
NPX device not present |
| EH_DOUBLE_FAULT | 0x8108 |
Double Fault error |
| EH_DEVICE_ERROR | 0x8109 |
NPX device error |
| EH_INVALID_TSS | 0x810A |
Invalid TSS error |
| EH_SEGMENT_NOT_PRESENT | 0x810B |
Segment Not Present error |
| EH_STACK_FAULT | 0x810C |
Stack Fault |
| EH_GENERAL_PROTECTION | 0x810D |
General Protection Fault |
| EH_PAGE_FAULT | 0x810E |
Page Fault |
If a debugger is running when the fault occurs, the debugger traps the fault and allows you to debug or delete the offending program.
On INtime Distributed RTOS when an unhandled fault occurs the DSM prints a message on the console about the process and thread which faulted, and the faulting address.
(use on any INtime node) A multi-threading debugger, Spider features source-level and symbolic debugging of your RT applications. Spider may be used to debug applications created with all Visual Studio versions, but has fewer features than the Visual Studio debugger. It's primary purpose is that while debugging a process, only the thread which has hit a breakpoint is stopped, all other threads run normally. The behavior of Visual Studio is to suspend all threads in a process when one thread hits a breakpoint.
You can access this program by selecting Spider Debugger from the INtime start menu. For detailed information about the Spider debugger, see the Spider Help file.
A hardware debug monitor. Use SDM to disassemble code, set and execute breakpoints, display or change microprocessor registers, and display or change the contents of memory. SDM is included in the INtime kernel. It is a 32-bit protected mode monitor that supports the Intel Architecture microprocessors. SDM has extensions which display information about INtime kernel objects such as processes, threads, and mailboxes. Use SDM to interpret data structures maintained by the INtime kernel; for example, INtime software system calls and stacks, the GDT, etc. For more detail, follow this link.
You can use your development system to debug an application on a separate runtime system with no development tools installed on it. You need a network connection between the systems to do this.
Load winntxproxy.exe on the target system to allow an NTX connection to be established between the two systems. Once this connection is established you can use your development tools to load and debug applications from the development host on the target. Winntxproxy runs on the target host as a service or as a console application. Running WinNtxProxy.exe as a service allows you to setup an enduring connection that will reconnect should you need to reboot.
Setting up the connection on the Target host:
On the target host, execute the winntxproxy.exe program. If you are installing winntxproxy as a service, you will also need to specify the -install command-line option.
Setting up the connection on the Development host:
Now when you start a tool such as INtex, you are offered a connection to the node you just created.
To configure a Visual Studio INtime project to debug on the remote system, you need to change the target node in the property sheet for the INtime project (represented by the INtime icon in the Solution Explorer window).
WinNtxProxy usage:
You can start winntxproxy in one of the following ways:
winntxproxy
winntxproxy -NtxClient <IPv4 address of dev host>
winntxproxy -install
winntxproxy -uninstall
winntxproxy -Help Note: If you have difficulty connecting to a winntxproxy node, make sure the firewall is configured to open UDP port 2112, which is required for NTX access. The product installer opens this port by default.
When running from the command line, run winntxproxy with Administrator privileges. If you are still having problems with a connection, winntxproxy may be trying to connect via multiple interfaces. Disable the other interfaces while debugging.
Console I/O to and from an application running on an INtime Distributed RTOS system may be redirected to a console window on a remote development system. It is also possible to redirect console I/O from an application running on an INtime for Windows host with the winntxproxy service running (see Remote Debugging, above). This is achieved by establishing a "host relationship" between the application platform and the SDK host, such that the SDK host replaces some of the services on behalf of the application platform.
You can use stealconsoleio.exe to establish or remove a host relationship with a Distributed RTOS node. Once that relationship is formed, console I/O and file I/O is sent to the Windows host. Applications that have already opened files and/or stdin/stdout connections will continue to use them. Any application starting after the host relationship has been established will use the new I/O connection mechanisms. Registry and clock sync services also change to rely on the newly registered host.
When a winntxproxy node is selected with which to register as a host, the I/O connection is changed differently. File I/O remains as it was previously using the INtime I/O Service. Stdin/Stdout I/O is rerouted through the host system. stealconsoleio.exe does not function with WinNtxProxy nodes.
StealConsoleIo.exe replaces the previous MakeINtimeHost.exe utility. StealConsoleIo.exe only interacts with INtime 6 systems. The previous MakeINtimeHost.exe utility is still included for interaction with older target systems.
Usage:
StealConsoleIo: opens the node selection dialog and will attempt to register as host with the selected node
StealConsoleIo <nodename>: attempts to register as host with node: nodename
StealConsoleIo -u: opens the node selection dialog and attempts to unregister the selected node
StealConsoleIo –u <nodename>: attempts to unregister as host with node: nodename